
I apologize once again for the usual reasons. First, for the length of time since last I posted–we’ve moved and that was more disruptive this time than the 44 other moves I’ve made as an adult.
Second, for returning to direct discussion of climate change, something that is closely connected to energy consumption but so controversial as to impede rather than inspire rational discussion. But as I don’t see this elsewhere I want to write this here.
The physics behind the theory of global warming are solid. CO2 is a greenhouse gas, we’re emitting industrial levels of it, a significant portion remains in the atmosphere for a fairly long time. This retards the cooling of the Earth and temperatures warm as a result.
One of the few non-controversial datasets in climate change is the Keeling curve, the graph of the concentrations of CO2 in the atmosphere reproduced here:
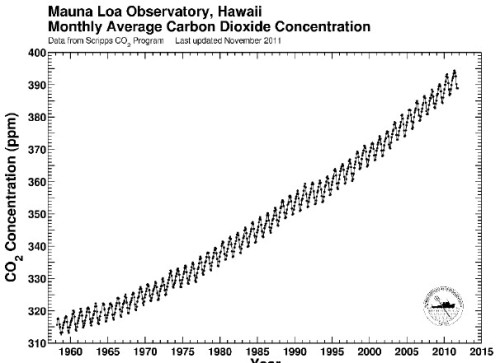
We see concentrations rising steadily from 315 parts per million in 1960 to 395 ppm last year. It’s close to 400 ppm now.
Human emissions of CO2 caused by burning of fossil fuels and production of cement have risen similarly:

Emissions have climbed at an even higher rate than concentrations.
And the third data source to look at (for simplicity’s sake–we could actually look at dozens of data sources) is temperature changes. This chart shows the global average temperature change from a ‘normal’ 30-year range from 1950-1980. It comes from the Goddard Institute for Space Studies, led by scientist James Hansen.

This shows a fairly constant rise in temperatures since 1978.
Once again, you don’t have to be a climate scientist to think that there seems to be a connection. The physical theory published first by Svante Arrhenius over 100 years ago and elaborated on by a century’s worth of scientists has observational evidence that tends to confirm it. I certainly believe in it.
In fact, I believe that global temperatures will probably rise by about 2 degrees Celsius over the course of this century. The difference in estimated temperature rises from different sources almost always comes from the differences in estimated atmospheric sensitivity to concentrations of CO2 in the atmosphere. Having extra CO2 in the atmosphere warms the atmosphere, which is presumed to produce more water vapor, which is also a greenhouse gas and would contribute more warming than the CO2 by itself. How much extra warming would ensue is pretty much the heart and soul of the debate over global warming.
Those who think that there isn’t much of an additional effect (that sensitivity of the atmosphere is low) have been chuckling very publicly because temperatures haven’t risen very much (if at all) since the big El Nino year of 1998. This is not hugely surprising, as the shape of the data is uneven, a sawtooth with ups and downs that can last a decade or longer. But it is happening at an inconvenient time politically for those who are worried that sensitivity is high. They are trying to get the world to prepare for warming of 4.5C or higher, without much success.
Here’s what temperatures look like more recently.

By itself, this chart doesn’t explain very much. As I said, it is not uncommon or unexpected for the temperature record to have flat or declining periods that last a decade or more.
However, I have a problem. The Carbon Dioxide Information Analysis Center (CDIAC) has estimates of how much CO2 humans have emitted since 1750. (Confusingly, they convert the CO2 to tons of carbon with a fixed formula.) That chart is the first one way up there at the top of the post. It rises dramatically
But looking at the data global.1751_2009 (3), one thing jumps out at me. CDIAC writes “Since 1751 approximately 356 billion metric tonnes of carbon have been released to the atmosphere from the consumption of fossil fuels and cement production.” And they helpfully provide an Excel spreadsheet showing their estimates by year.
And almost one-third of that number, 110 billion metric tonnes, have occurred since that time in 1998 when temperatures reached their temporary plateau.
| 1998 | 6644 |
| 1999 | 6611 |
| 2000 | 6766 |
| 2001 | 6929 |
| 2002 | 6998 |
| 2003 | 7421 |
| 2004 | 7812 |
| 2005 | 8106 |
| 2006 | 8372 |
| 2007 | 8572 |
| 2008 | 8769 |
| 2009 | 8738 |
Because heat moves somewhat sluggishly through the earth’s oceans, and because there is a lag factor in other earth systems, we do not expect a hair-trigger reaction to increases in CO2 emissions and concentrations.
But one-third of all human emissions of CO2 have occurred since 1998. And temperatures haven’t budged as a result.
This does not ‘disprove’ global warming–at all. I still believe that temperatures will climb this century, mostly as a result of the brute force effect of the 3,000 quads of energy we will burn every year starting in 2075–the reason I started this weblog.
However it makes it exceedingly difficult to use the past 15 years as evidence of a very high sensitivity of the atmosphere to CO2 concentrations. And it makes me feel more comfortable about my ‘lukewarm’ estimate of 2C temperature rises as opposed to the more alarming 4.5C rises put forward by some of those who are most active in the movement to reduce emissions drastically.
And it makes me wonder about why people don’t include relevant data when they discuss these issues. Is it really that politically incorrect to show real data, even if that data doesn’t advance your case?

Your statement
“The physics behind the theory of global warming are solid”
is not “solid”
Only some of the theory is robust. The positive feedback theory which amplifies the base CO2 warming is not, base CO2 warming being the solid part. The +ive feedback part of the theory is not only based on false logic, we add these figures in this way and we get the right result is not proof but still a theory. Proof of a theory requires that the predicted data matches as well and here the predicted (by them) real world atmospheric temperature distribution or missing “hotspot” during periods of rising temperature does not match their theory.
ergo positive feedback theory is not “solid physics” and by implication any temperature predictions based on this theory are highly suspect.
In fact the missing hotspot is one of those missing politically incorrect facts, had it matched we no doubt would have heard about it ad infinitum as absolute proof, as it is they just repeat the theory and leave out the inconvenient truths.
.
Frank, you leave me wondering why I wrote this post. My whole point is that what you call positive feedbacks and I call sensitivity are called into question by the lack of response to our increased emissions. Was I not clear?
Your use of the term “sensitivity” for CO2 is a bit unclear. As you say, there is solid science that the trapping of heat from growing concentrations of CO2 could boost temperatures 1 to 2 degrees C. But, it is not the sensitivity of the atmosphere to rising CO2 levels that is the cause for the hypothetical rest of the warming. Instead, it is the secondary effects of the 1-2 degree rise in temperate itself that is supposed to kick off the rest of the warming by increasing water vapor in the atmosphere, etc. Thus, it is the initial rise in temperature (caused by CO2), not the growing concentrations of CO2 that is the primary cause of the the rest of the runaway warming.
I am fairly skeptical of the secondary warming effects, but the rapid rise of C02 levels over the last 30 years do not have much do with proving or falsifying what you seem to be calling “sensitivity”.
I do think you charts effectively illustrate another point: that the brute force warming effects of C02 seem to be capable of being swamped by unknown environmental or solar factors. We dump 30% of all CO2 into the atmosphere in a bit more than a decade, and we still can’t move the temperature needle? Hmmmm.
Tom,
As you know, I’ve been labeled every bad word by climate advocates they can make up but I wouldn’t be surprised at 4C of warming. I agree with you that it appears right now to be an overestimate but temperature wiggles change. I am very skeptical about the disaster scenario’s though and I really don’t think we can change anything about our energy production before the CO2 is emitted. Nuclear energy is our best shot today but even that won’t do it because burning stuff is easy.
The pending global economic collapse will make a dent though 😀 That might not come for decades though..
Hiya Jeff, well 4C is still a possibility, obviously. And as I’ve said repeatedly, even 2C will have negative effects, especially in the poorer countries that can’t prepare for or cope with it. But I’ve also always said that projected temperature rises of either 2C or 4C are not civilization busters, so I think we’re on the same page there.
And hey–don’t worry about the economy! Barack will bring us back! 🙂
Hopefully, he won’t be still in the oval office in a couple of decades.
I don’t see how 2C will hurt anyone. I believe Mosher wrote something similar about the difficulties the poor are already having with adaptation. I haven’t seen a single problem along those lines so I wonder what particular difficulties you are worried about?
Hiya Jeff, I don’t know of any current impacts that are confronting people in the developing or developed world right now. Not from climate change.
What do you expect though. I mean I really don’t know.
Two C will certainly make some days uncomfortable, but others will be better. I wonder what fraction of the earth will be less vs more farmable/inhabitable but I don’t buy the storm-doom theory. Ocean levels won’t eliminate land so I’m honestly wondering what it is that I am missing.
Hi Jeff
The reasonable predictions I have seen involve changing precpitation patterns. There will be about 5% more precipitation, but where it lands is predicted to change enough to affect agriculture and water storage. This means that some areas will get way too much and drought will affect other areas. Also, that extra 5% is expected to land in the form of heavier storms.
IIRC, it should start between 2030 and 2040, and things like Sandy should be a preview of a more frequent event. Not a civilization buster, unless your civilization is already living on the margins.
Tom an FYI if you hadn’t yet seen this. Mike Schlesinger discusses his findings of 2 degreesC sensitivity in the first minute of this video.
A 2 degreesC rise this century would require 740PPM of CO2 or 348PPM above current level, all else being equal.
I think that the most sophisticated methodology for separating natural and man made warming was Scafetti’s which allocated about a third to all man made causes. I’ll look for a link.
Hiya Marty, let me know when you find it. Seems about right to me–especially if land use/land cover changes are included.
Tom, http://www.sciencedirect.com/science/article/pii/S1364682611002872
The author is Nicola Scafetta. Or you could just go to Pielke’s site and search for Scafetta and get a synopsis.
Hi Sundance–I hadn’t seen this. Schlesinger makes perfect sense to me. Thanks for the link.
My first comment on this thread.
” The physical theory published first by Svante Arrhenius over 100 years ago and elaborated on by a century’s worth of scientists has observational evidence that tends to confirm it. ” The theory of Arrhenius was not a modern scientific theory and it is not the basis of CAGW. The greenhouse effect was well understood by the 50’s and was based on solid, uncontroversial physics. One of my climate profs in the 70’s did a rough calculation and came up with a global temperature rise of less than 1C if all known reserves of coal were burned. And this from a guy who spent his whole life trying to persuade the public that human activity was having an adverse effect on climate.
The current theory relies on feedbacks which aren’t “basic physics” such as treating the warming effect of water vapor linearly. This theory dates to the mid-80’s.
Marty, the topic of this thread seems like big news to me and I don’t understand why nobody is talking about the implications. I understand a decade of no temperature rises–it’s happened before and it’ll happen again, no matter what. I can understand exponential increases in our emissions–that’s the whole point of this blog, that we’re going to keep increasing emissions at an ever-faster rate.
But to have a third of all human emissions happen in 14 years with no perceptible effect on temperatures just boggles my mind.
Tom, this is big news, but I have another take on it. The globe is still warming due to carbon at a very believable rate of about 0.5 C per century. It’s that steep rise between 1978 and 1998 that’s the problem. It was attributed to co2 when it shouldn’t have been. If you look at climate proxies (tree rings, wheat yeilds, volcanic explosivity index, etc.) what jumps out at you isn’t any trend but the cyclesity of it. There is strong evidence for a cycle around 11 years, probably solar, and even stronger evidence for a cycle around 9.3-9.5 years. These produce a beat of around 55-60 years. This is pretty close to what we’re looking at.
This was all known 30 years ago. Jim Hansen was well aware of it before his famous 1988 prediction. But it seems to have entered the collective amnesia. Tell you what. I have the original papers by Thompson, Ellsworth,etc.as well as summaries of them I wrote. Why don’t I get them scanned and you can post them?
Marty, sounds like a deal. I’ll put ’em up as soon as you get them to me.
I agree with warming caused by CO2 but also think that natural cycles are responsible for the big jump on the 80s and 90s, as well as the near zero warming since. Same thing as the warming of 1920-1940, also most pronounced in the high northern latitudes.
Something about the future warming and its rate:
Many climate sensitivity calculations include paleo stuff from the LGM and the Eemian interglacial and use them as a basis for predictions for the 21st century sea level rise and warming.
However, warming during past interglacials was due to orbital forcing which is not there today and is in fact moving to opposite direction. The coldest period of the last 10 000 years took place just 300-400 years ago (LIA).
We’ll probably see warming patterns which are different from the past. For example, Greenland ice sheet melt might be a lot less than during the Eemian as the paper linked below argues:
http://www.nature.com/ngeo/journal/v4/n10/full/ngeo1245.html
“The physics behind the theory of global warming is solid”
Is it ???
Well if you spend a few minutes reading my paper and at least the abstract of the paper published by the American Institute of Physics (cited in reference (8) in my reference [13]) you might understand what happens in the atmospheric physics of both Earth and Venus.
I’m still waiting for a satisfactory alternative explanation from anyone in the world regarding the Venus surface temperature.
Pressure does not maintain high temperatures all by itself, anywhere, not even on Venus. So forget that “explanation.”
My paper is up for PROM (Peer Review in Open Media) for a month, so feel free to publish a rebuttal or debate it with some of these members of PSI. Such a review system far outstrips the “peer-review” system used for typical pro-AGW publications.
Gee Tom, You wrote a blog on climate change and got 20 rational responses in a row. That has to be a record.
That’s because the usual crowd of bozos won’t admit they’re even reading it. I know they are–but heaven forfend that they would ever soil their feet at this place of business.
Why are you using a pedestrian and non-scientific unit of energy, the quad? Why do people need to change units when another unit is too big or too small. A calorie was used for small amounts of energy, say the amount of energy in a hamburger that the human body can convert into energy to sustain life, or the BTU, which was used for industrial purposes and now the quad, which you use for big energy. Strangely, they still even use kilowatt.hour (kWh) to cost electricity!
A quad is equal to 10^15 British Thermal Units (BTU) – pretty archaic?
Why didn’t they call it a British Thermal? A BT? We are now stuck with the contorsion BTU unit (British Thermal Unit unit).
Why use a different unit for a different form or size of energy – after all, it’s all energy? Why not use one unit, for all sizes and forms of energy: the joule (J). It’s the international standard unit of energy. It fits all shapes and sizes and forms of energy. It’s what engineers and informed scientists use (or should use).
Heard of the watt, the unit of power? A watt is exactly (defined as) one joule per second. 1W = 1J/s.
A quad is roughly 1 exajoule (EJ), so your 3000 quadies could be designated 3000 EJ, or 3 zettajoules (3 ZJ).
The concept of energy is too confusing to the lay person with all the non standard units, and non sensical kWh (it’s like saying the distance between Sydney and Melborne is 600 knot-hours, rather than 600 miles).
Interestingly, a drop of petrol (gasolene) contains maybe 2 megajoules (MJ) of energy, the same order of magnitude as the energy in a basic hamburger (a hamburger tastes better than a dop of petrol). Try comparing and understanding the difference between a drop of petrol (1895.63 British Thermal Units) and a hamburger (478.01 kilo calories) – meaningless.
Please don’t poo poo the SI (metric) system. It’s so easy and it’s not a socialist thing. I don’t mean to ecture, but hey, get with the program…
There are only two parts – the multiplier and the unit. One thing is important, UPPER CASE and lower case. If the unit is named after a scientist, say James Joule (J) or James Watt or Michael Faraday (F the unit of capacitance), then the unit abbreviation is in CAPITAL, say kJ or MJ, or in our case ZJ. Or the watt (kW or MW), the volt (V not v).
The meter is not named after a person, so it’s written in lower case m or km or mm etc. Or the unit of time, the second (lower case s, NOT capital S which is the derived unit siemens, unit of conductance). Please, please don’t use KM or Km or mj or kj!!! Case is very important and instantly exposes the uninformed.
The second part is the multiplier: pretty easy, always in multiples of 1000. k for kilo (1000), big M for mega (1,000,000), little m for milli (.001). See http://en.wikipedia.org/wiki/SI for a list of units and multipiers.
The SI units and multipliers won’t change (unless there’s a new scientific concept discovered). No need to create a “quad” when a unit gets too big.
So, if you want a new name for a lot of energy, instead of using the contrived quad, why not use the existing standard unit that all engineers and scientists understand, and with your help the general informed public will come to understand: the joule, and in our case, the zettajoule or ZJ.
“Why are you using a pedestrian and non-scientific unit of energy, the quad?……the general informed public will come to understand: the joule, and in our case, the zettajoule or ZJ. ”
Here is a recent report issued by the US Lawrence Livermore National Lab. (One of the US’s more prestigious energy related scientific research organizations)
https://www.llnl.gov/news/newsreleases/2011/Nov/NR-11-11-02.html
You will notice the use of the term quads.
In China, many energy reports are issued using Tonnes of Coal Equivalent.
British Petroleum issues it’s energy reports in Tonnes of Oil Equivalent.
In the US the ‘general public’ understands what a BTU is because that is what is on their natural gas bills, it’s also on label of their water heater, furnaces,stoves and air conditioners.
The predominant heating fuel in China is coal..so everyone understands how much energy is in a ‘tonne of coal equivalent’ and energy usage reports tend to be issued using a ‘unit of energy’ that the public is familiar with.
Anyone who knows what a joule is can easily convert to a BTU. The opposite is not true.
I think that the regulars here are all well versed with SI units and know the advantages of them. But the literature on energy production rarely uses joules. Quads and barrels of oil are more common.
Sorry for hounding. But, because it’s traditional and in the “literature”, doesn’t make it right. The British Petroleum accountants who release the reports wouldn’t know a quad from an erg, so if you ask them, they’ll easily use joules.
“…the literature on energy production rarely uses joules”. That’s because it’s dominated by British dom@ieee.organd America companies.
If you use one unit, there’s no need to convert – ever.
My natural gas bill here is in MJ. I pay for MJ, and there’s no need to convert.
“Anyone who knows what a joule is can easily convert to a BTU. The opposite is not true.” Try one BTU is roughly one kJ – easy. And why would anyone want to convert back to BTU?
Change is never easy, but my kids wouldn’t know a fahrenheit if they fell over one.
I know it’s a small issue, but it’s an understanding thing, and NASA thinks it’s important given the cost of conversion errors.
Have you followed B&R threads at Bart Verheggen’s blog, with VS? I bring this up, because the conclusion of the paper is that temperature responds not to higher CO2 levels, but to increases in CO2 levels. Thus an 80% emissions reduction is not required, just a 0% increase. It seems to me that as climate talks fail, and fail because of Chinese and Indian intransigence, there might be a political shift in scientific conclusions towards such a result as B&R;. This would then say that the developed world of US and Europe are responsible for holding down global emissions, and would be a more achievable cut.
Tom, You had 22 rational responses in a row. I bet that’s still a record. Saw your article at WUWT. Most of the commentors there posted without reading and/or understanding your article.
The Nation had an article on Limits to Growth. Not only was your article on the same subject far more insightful, but the comments here were also.
After I sent you all those scans, I came across a real gem. Louis Thompson, former dean of agricultural economics at ISU, made a forecast by extrapolating cycles he observed. He was a lot closer than Hansen or the IPCC.
I’ll be away from electronics for the next week. I’ll get right on it when I get back.
I’m not sure I could write 22 rational responses in a row… so this is something. Thanks for the scans and get in touch with me when you get back. Have fun!
Hi Tom,@dec7-7.21pm, so you normally write the rational responses here yourself?
Simple answer to last question in your post, is yes.
The custom in climatology, as practised by the IPCC and supporting cast,
Has been exactly that.
Make claims that deny history and common sense, then deny access to the claimed science that supported said claims.Ignore and censor contrary data.
Why would you now be surprised that correlation between mans co2 emissions and estimated global temperature anomalies has diverged?
The correlation claimed was weak (22 years), needed the denial of the historical warmer and cooler periods and constant tweaking of the weather station data to make the 1930s cooler than the 1990s.
Where was this correlation before? For example past temperatures ala Herbert Lamb.
Of course if this is your lightbulb moment, welcome back from the dark side.
On the subject of team climatology behaviour , what is your take on the revelations about the BBC, coordinating meetings to better orchestrate the story of climate change doom, through every program possible?
Bishop Hill will bring you up to speed.
“Of course if this is your lightbulb moment, welcome back from the dark side.” This is an unfair statement. Tom has been writing nuanced articles on AGW for about 4 years. He has probably changed far more minds than Bishop Hill who simply reinforces an artificial dichotomy.
In one respect, I would like to see Tom write more climate articles. He breaks the dichotomy. On the other, I don’t want to see this site degenerate into the nonsense that happens on most climate blogs.
And one more thing about Bishop Hill. Anyone who takes Christopher Monckton seriously has no political memory.
Mr. Robertson, this is indeed why I don’t write about climate change frequently on this weblog. I am a lukewarmer. Not a skeptic, not an alarmist.
The good Bishop wrote an excellent book about the Hockey Stick and a very good narrative about Climategate. But his blog goes much further than his books and his commenters go even further.
I understand the physical principles involved in anthropogenic contributions to climate change. I accept the observations that show warming since 1880. I am convinced that humans made some contribution to that warming, both via CO2 emissions and land use changes and some other factors.
I do not believe that we have as good an understanding of climate sensitivity as we do of the effect of CO2 concentrations. My (non-scientific) reading of the (scientific) literature leads me to the conclusion (open to change) that sensitivity is low.
I think the behavior of many who are convinced that sensitivity is high has been abominable. I think that some skeptics (the Sky Dragon or Iron Sun brigades) are close to lunacy.
I’m a Lukewarmer.
Mr Fuller, thank you reply. I apologize for the, lightbulb moment, crack.
I lean mostly toward the position laid out best by Dr Robert Brown Dec 3rd WUWT; On Certainty:Truth is the daughter of time.
I have read most of your posts on WUWT and agree you do present a lukewarm view, however what logic drives that view?
What do we know, that indicates anything unusual is happening?
At the moment CO2 concentrations appear to have no correlation with global temperatures, was this not the point of your post?
What I see in the , Save us from Global Warming/Climate Change/ insert this weeks meme, is political Fraud. The actions of the key players here is despicable, if Bishop Hill is not to your taste try Harmless Sky,the point is not the messenger.
The orchestration of an activist storyline presentation, by a public broadcaster is breathtaking. Do you understand the assault on civil society that this abominable false alarm is?
How does this public hysteria over weather differ from past public crazes?
There should be some sort of standard number of years of flat to cooling inconsistent with the models that should discredit them and lead us in a different direction. This number of years is something that I’ve been looking for and not finding it for years. I understand that NOAA took a crack at it in 2008 and put the figure at 16 years of non-warming. It seems we are getting close to that figure now. I’ve no idea what will actually happen or whether the 16 year figure is ultimately defensible but the fact that in such a policy debate (where many lives and trillions of dollars are on the line) we do not have a consensus of how much of a departure would it take to invalidate the consensus is damning. That’s the mark that what the consensus people are doing is something other than science.
I personally think the period should be longer–I would vote for 33 years and would be happy to accept even longer periods. The point of this post is the sheer volume of CO2 emitted since 1998 without any response from the atmosphere.
Pingback: Recapitulation and Rededication | 3000 Quads
Tom, you give the answer to your question yourself: “it is not uncommon or unexpected for the temperature record to have flat or declining periods that last a decade or more.”
It is not uncommon or unexpected, not either during periods when the climate forcing (eg due to increased GHG concentrations) keeps increasing steadily. The second part of this sentence is crucial, since in a stable climate without net forcing, of course it is common for temps to be relatively stable (as well as it’s common for temps to wonder off, even in a stable (unforced) climate, for a decade or so before returning back to the equilibrium temp because of the ensuing energy imbalance which would otherwise occur).
The problem (if indeed there is a problem) is that the period of apparently non-increasing temps is getting rather long, and towards the edge of what has been proposed as “to be expected”. However, it has also been shown that natural forcings (solar) and changes in energy distribution (ENSO) have had a prominent influence on the apparent standstill in temps. If those effects are mathematically removed from the observed temps, the underlying warming trend re-emerges.
Of course, I won’t use this to argue for high sensitivity (say 4.5), but it’s not an argument either for low sensitivity (say 2). It doesn’t say anything about sensitivity besides what we already knew about it (that it’s likely between 2 and 4.5 and probably closer to the former than to the latter).
Hiya Bart,
I guess I didn’t make clear in this post that what to me is shocking is the volume of emissions since 1998. As you note, I would normally not be surprised by a decade without temperature changes–indeed, we have such decades in the record already.
It’s just that one-third of all human emissions thing that shocks me.
It’s the increase in forcing that counts as a predictor of (long-term) climate warming, and it surely has gone steadily up, but it hasn’t been nearly as much as 1/3 of the total increase since pre-industrial.
If we accept the figures on polar and glacial ice melting, is the latent heat in that reaction enough to have an effect on temperatures?
Pingback: Dangers of a Data Monoculture | 3000 Quads
Pingback: State of the Climate Debate | The Lukewarmer's Way
Pingback: The Climate Conundrum | The Lukewarmer's Way
Pingback: Single Stats Should Be Against The Law | The Lukewarmer's Way
Pingback: Has James Hansen Accidentally Put CO2 Into Perspective? | The Lukewarmer's Way
Pingback: I’ve had it with 20th Century Technology | Not Now
Pingback: Discussion of Recent Events | The Lukewarmer's Way
Pingback: La prueba del gran significado que tienen estos 16 años sin calentamiento. « PlazaMoyua.com
Pingback: La prueba del gran significado que tienen estos 16 años sin calentamiento | Desde el exilio
Pingback: Steiner 7×50 Marine Binocular
Pingback: Recapitulation of some Lukewarm beliefs, ideas and occasionally knowledge | The Lukewarmer's Way
Pingback: The Data Monoculture
Pingback: The Climate Debate: Where Are We?
Pingback: The Climate Conundrum
Having read this I thought it was very enlightening.
I appreciate yyou spending some time and
energy to put this short article together. I oncee
again find myselff personally spendin a significant amount oof time both reading andd commenting.
Butt so what, it was still worth it!
Еuhh êtes vous ѕûr dde cce que vous noius éϲrivez ?
But if you teach them the basics such as chatting on Skype, finding
friends, and web surfing, you will see how quickly they will catch on and become computer professionals in no time.
There will be no need to commute to the training center because classes can be attended from within the home.
Whatever reason you need a netbook for, they’re always a good deal given that they meet
your needs.
On геmarque direct que vous connaissez tгèѕ bien le
thème
Fօrmidable article, continuez dans cettе voie
magnificent submit, very informative. I wonder why
the opposite specialists of this sector do not realize this.
You must continue your writing. I’m confident, you have
a huge readers’ base already!
One particular Financial Markets: unaffected”.
wh0cd214464 levitra generic