
My last post got linked, republished and talked about, apparently. We got a lot of traffic as a result.
I suppose I should be tempted to sink back into the morass of the climate wars and go for the big traffic that might justify my adding ads to the site. For now I’m going to resist. There are too many places where people can go to talk about climate change, and too few where energy is the focus. And I think this might be the only one with a micro focus on energy consumption.
Energy consumption. The worry of mine that gave birth to this weblog is that we are underestimating future energy consumption and as a result are sleepwalking into a world where coal becomes (again) the default fuel used to power the rise of the developing world. We’re not doing the infrastructure planning that will allow nuclear, hydroelectric, wind/solar/biofuels and even natural gas to take some of the burden off of old king coal.
Specifically, in the near term I project that the world will use 947 quads in 2035, far more than the 712 estimated by the DOE EIA, the IEA and the U.N. I also project it will only get worse after 2035, leading to an incredible 3,000 quads every year by 2075.
Of course this will have an effect on climate–even if atmospheric sensitivity is as low as I think (and hope), the brute force effect of the emissions associated with that much consumption of coal will impact our climate.
I’ve tried to show it and discuss it. So far, more than 22,000 visits to this blog have maybe convinced a few hundred people that I have a case. I hope so.
On to today’s topic. The Department of Energy’s Energy Information Administration has published their Early Release of the U.S. Annual Energy Outlook for 2013.
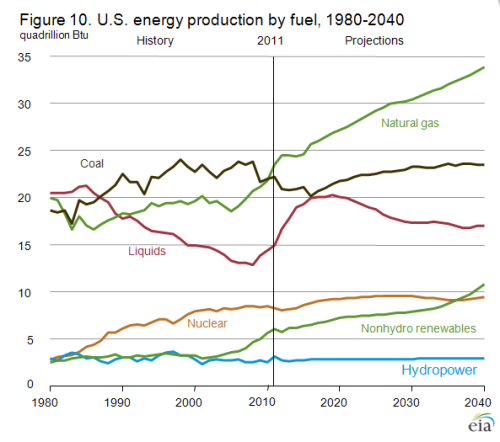
Some key points:
- Domestic production of crude oil is increasing and is expected to continue to increase, reaching 7.5 million barrels per day by 2019
- Our consumption of natural gas is also expected to increase, from 6.8 trillion cubic feet per year in 2011 to 7.8 trillion cubic feet in 2019
- They have increased their projections of generation from solar and wind, from 13% of the total in 2011 to 16% in 2040. The EIA is not so optimistic about advanced biofuels, lowering the predicted output from all biomass from their 2012 prediction of 5.4 quads to 4.2 quads by 2035
- With improved efficiency of energy use and a shift away from the most carbon-intensive fuels, U.S. energy-related carbon dioxide
(CO2) emissions remain more than 5 percent below their 2005 level through 2040 - They have upped their prediction of GDP growth per year, from 2.5% to 2.6% CAGR through 2040.
- As for the reason I was so eager to look at the report… they obviously don’t agree with me. They predict that total energy consumption will rise by a total of 7% by 2035, from 98 quads in 2011 to 104 quads in 2035 and then by 6% to 2040 to a total of 108 quads. (I think it will be higher.)
- Their justification still centers around their belief that energy intensity will decline as total U.S. population increases by 29 percent from 2011 to 2040, but energy use grows by only 10 percent, with energy use per capita declining by 15 percent from 2011 to 2040. I want some of what they’re smoking
Overall, I still think they’re looking too much at the inputs to their models–pricing and supply constraints, availability etc., instead of accepting that the demand for fuel is not very price sensitive and will be driven by population and GDP growth. Energy efficiency will surely help us out. But we’ve picked a lot of the low hanging fruit from that tree, and future progress in energy efficiency will be progressively more difficult.

I would agree that the EIA emphasizes price trends too much.
Having said that I do think they look at saturation as well.
If we look at Aluminum consumption..clearly and energy intensive material. US Consumption was at 5.2 million tons in 1973. The population of the US in 1971 was 211 million. It peaked at 7.1 million tons in 1999(A very good year for aluminum in the US and has been less then 5.1 million tons since 2007.
Click to access ds140-alumi.pdf
If we smooth for boom and bust years per capita consumption of aluminum has been declining for 40 years, even as automakers increase aluminum content. The same trends hold true for steel and cement.
I can’t be bothered at the moment to look up the references.
In 1970 about 50% of US homes had air conditioning. The most recent number I saw was 87%. There is a small shopping mall just outside of Seattle built circa 1960’s. On their sign in big letters is ‘fully air conditioned’.
It was an exception, not a rule that retail establishments would have air conditioning. The sign seems silly now or for me nostalgic as I remember when most retail establishments weren’t air conditioned. Virtually all retail establishments and office buildings are air conditioned now.
We have reached saturation in the percentage of commercial and residential floor space that is air conditioned. No longer do ‘efficiency improvements’ have to offset a growth in floor space plus a rising percentage of floor space that is air conditioned.
If we look at this detailed analysis of projected energy demand the underlying assumption was that the increase in per capita residential and commercial floor space would increase along existing trend lines. A commonly held assumption right up until the ‘housing boom’ ended.
Click to access PNNL-16869.pdf
I don’t need to look any further then across the street to see that the age of ‘McMansion’s’ is pretty much dead. Nice early 40’s couple..annual household income of $500K living in an 1800 sq foot circa 1970’s split level that they bought for $400K. Younger people don’t want to be a slave to a big mortgage payment unlike my generation or my parents generation where the ‘commonly accepted practice’ was to buy the biggest house on the biggest lot you could possible afford. It’s popular to blame the banking crisis and housing bust on ‘evil bankers’ but a big share of the blame goes to the fact that the Baby Boom turned 60 and they are no longer looking to ‘move up’ into bigger and better.,..and neither are younger people.
Hi Tom,
You claim we may be underestimating future energy consumption, but if I remember correctly, you also claim we overestimate future CO2 emissions.
Isn’t that contradictory?
It wouldn’t be if you’re confident that most future energy will come from carbon neutral sources, but I guess you’re talking about a BAU-type scenario in both cases. In which case it indeed is contradictory.
Hiya Bart,
Glad to see you can make it over here from time to time.
No, my prediction for 2035 is that the planet will consume between 900 and 950 quadrillion BTUs annually with well over half provided by coal. I think if we are extraordinarily diligent about renewables we can get to 20% green energy by that time–but it doesn’t look as though that will happen.
As always, I need to mention that I am the pessimist about consumption. Both the EIA and the IEA project about 700 quads by 2035. But at least I show my work.
Hi Tom,
I think your analysis about price sensitivity and GDP is dead on. We have very expensive fuels in Finland but it has not led to drastic cuts in consumption. Prices have to rise a lot (like over 30 eurocent /kWh electricity in Denmark) before consumption comes down.
The US is becoming, at least for 10-20 years, a country with very affordable energy, thanks to shale gas. European companies are already shifting manufacture of products that benefit from cheap gas (chemicals etc.) into US. Rise of wages in China is also shifting production back to the US. Manufacturing based in the US will have quite good times ahead. More jobs, more people, more growth.
Thanks Tom.
I understand how you view the projected energy use. But I sense a contradiction in projecting higher energy use than “mainstream” (mainly consisting of fossil fuel) but at the same time projecting lower CO2 concentrations. The former you state about 2035, whereas the latter I’ve seen you state about 2100. Still, it puzzles me, since fossil fuel use and CO2 emissions are closely coupled, as you rightly indicate.
Having just finished reading the 2013 early release.
It’s about as ‘non-commital’ as it could be and not be considered a complete joke.
The coal section admits that there will be continued decreases in mine productivity then assumes that those loses in productivity will be offset by ‘new mining techniques’.
There is nothing in the electricity section as to what happens to heat rates. I.E. The input heat rate per KWh for natural gas has dropped from 10,000 Btu to 8,000 Btu in the last 10 years. Does the trend continue, does it stop?
The estimated build rate for nuclear thru 2040 is only projects that have ‘shovel in ground’ now. Why did the administration just agree to spend $450 million on licensing SMR’s if none are going to be sold?
Our coal fired capacity never drops below 278GW although almost everyone believes that about 50GW of capacity will retire by 2020 but the EIA doesn’t think any will retire after that.
Maybe it would be better to issue a one page report with the words ‘Don’t Have a Clue’.
Hi all,
Bart, first off, the lower CO2 figures for 2100 that I have referenced in the past were not mine–the IPCC said in AR3 that emissions would start to decline about 2105, due to declining population totals and increased take-up of renewable energy supplies. My crystal ball doesn’t go out that far, sadly, although their projection does not seem at all ridiculous.
I’m pretty sold on my idea of much higher energy consumption, although you’d probably have to read the report I wrote (here on the website in the sidebar) to understand my thinking. I may be in the minority, but I’m pretty confident.
Jarmo–yeah, energy consumption is not very elastic. Once people get a taste of what electricity provides, they’ll make a lot of other sacrifices to keep the lights on and the TV running.
Harry–I gotta admit, I don’t understand what they’re thinking over at the EIA. I’m not surprised they canceled their global forecast. Ever since they had to completely redo their estimates in 2010, they seem pretty much at a loss.
There are some bright people over there–I’m sure they’ll figure it out eventually. I just hope city planners and infrastructure developers are looking at their core assumptions before making decisions.
Tom,
Look at this ‘Energy Guide’ label for a TV I was dreaming about(It’s too big).
Click to access 655615_EG.PDF
The ‘estimated’ energy consumption is 1/2 the lowest ‘range of similar models. I actually only saw one TV in the store where the estimated energy usage was within the ‘range of similar models’.
They can’t even keep up with ‘Energy Guide’ labeling…how are they supposed to ‘project’ into the future? Are their going to be black swans?
What will their impact be?
Then on top of all those complexities any pronouncements EIA makes are going to have an impact on the market value of various energy companies. So any projections of ‘shifts’ have to be very conservative in nature.
It will be interesting to see whether Jevons paradox (rebound effects of increased efficiency) still work. But I think US consumption of energy is on a downward trajectory.
In places like China and India the fact that tv’s and fridges now consume less energy than 10-20 years ago does not make such a great impact: there are still hundreds of millions of people without a tv and a fridge. Just think about how much power will be needed if 50% of the Indian homes are air-conditioned.
Click to access WP226.pdf
in urban China there were 8 air conditioning units for every 100 households in 1995, and by 2009, there were 106 units for every 100 households
The Chinese are well beyond the refrigerator and TV stage.
production statistics for china
http://www.stats.gov.cn/english/statisticaldata/monthlydata/t20121114_402851273.htm
About 6 million refrigerators , 9 million air conditioners ,14 million TV’s and a staggering 97 million cell phones per month. Obviously many will be for export. The last I checked the entire US TV market was 35-40 million per year.
IMHO any statistics regarding China that are more then 3 years old are hopelessly out of date. The current build rate for urban residential housing is enough to comfortably house an additional 24 million people per year.
India is another story.
The urban Chinese have all the goodies. Rural China is a different story. Poverty in China is rural.
In 2010, it was estimated that there are 500 million people living on with less than 2 dollars per day. In 2011, it was reported that there are 150 million people in China living on less than 1 dollar a day.
These people have little money to buy stuff. However, there is a subsidy given to poor people to buy a fridge…. apparently to support domestic industry and promote rural well-being.
at what point will it be better to air-condition entire cities, the really dense ones?
An interesting perspecting on OECD energy growth from EvilOil.
http://www.ogj.com/articles/print/vol-110/issue-12b/general-interest/exxonmobil-sees-gas-displacing-coal-as.html
“ExxonMobil’s 2013 energy outlook also sees efficiency continuing to play a key part in solving energy challenges. Hybrid vehicles, high-efficiency gas-fired power plants, and other technologies and practices will help industrialized nations within the Organization for Economic Cooperation and Development keep energy use essentially flat as their economic output grows 80% by 2040, it said.”
wh0cd31304 buy crestor celexa
wh0cd802951 methotrexate for more info
wh0cd940149 levitra